The Problem
Your Health Data
Is Everywhere.
Wearables know your heart rate. Fitness apps know your workouts. Lab reports know your biomarkers. You know when you feel unwell. Your doctor sees fragments of your history. But these pieces rarely become one understandable story.
Wearable
Workout
Sleep
Symptoms
Labs
Prescriptions
Glucose
Cycle
Nutrition
Data Is Everywhere.
Understanding Isn't.
The Concept
The Wearable Is
Just The Beginning.
GRND is an ecosystem: physiological signals, behavior, symptoms, and medical records connect into one continuously learning personal health timeline.
Timeline
Sense
Your Body Never Stops
Producing Signals.
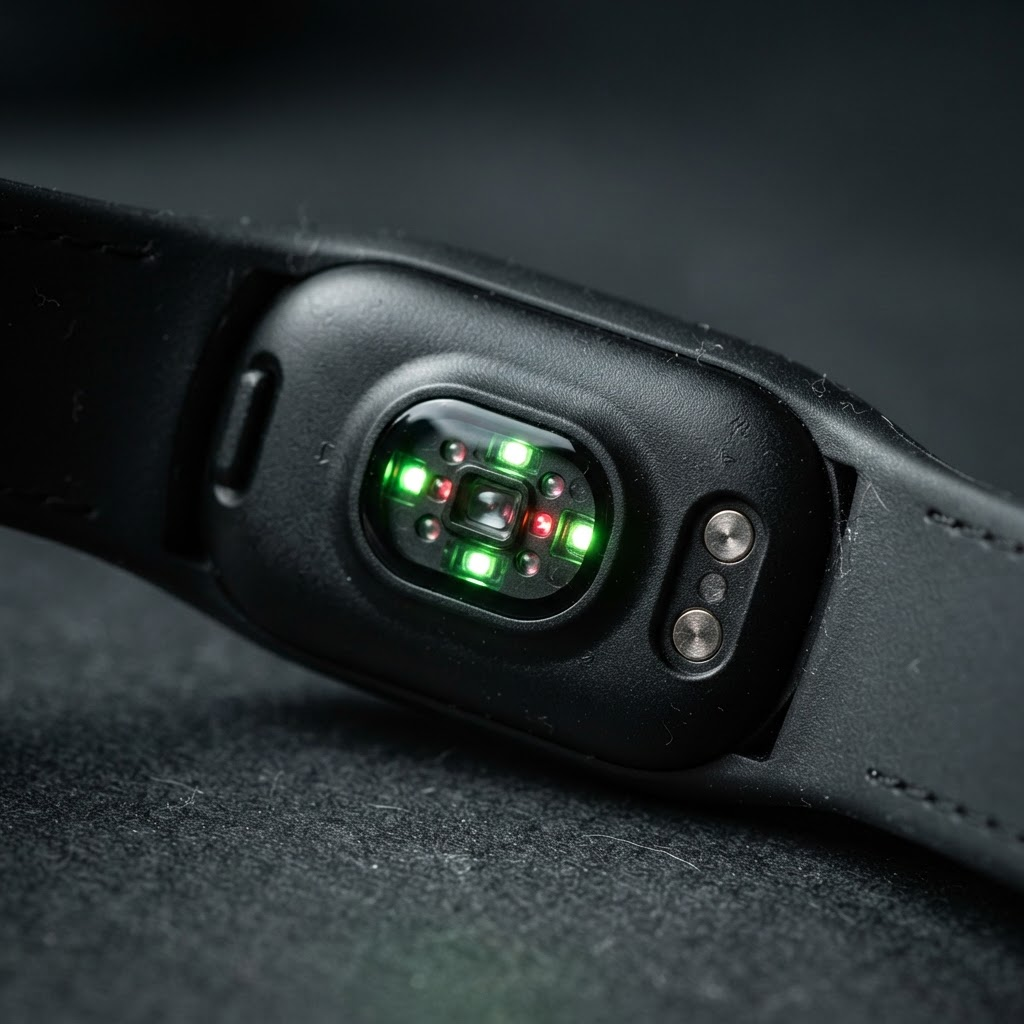
GRND continuously senses the physiological signals your body produces, quietly, in the background, all day and night.
Heart Rate
61bpm
HRV
58ms
Resting Heart Rate
54bpm
Sleep
7h 42m
Respiratory Rate
14.2rpm
Temperature
36.4°C
Activity
612kcal
SpO₂
98%
GRND provides wellness insights and is not intended to diagnose, treat, cure, or prevent any disease. Sensor readings are not medical-grade unless explicitly stated.
Automatic Detection
Just Work Out.
GRND Keeps Up.
No taps, no setup. GRND automatically detects strength training, running, walking, and cycling, then logs the full performance picture to your timeline.
Strength Training
DetectedRunning
Walking
Cycling
Added to Timeline
Strength Training
Personal Baseline
Normal Is Personal.
GRND learns what is normal for you, specifically, instead of comparing your body to population averages. Every metric is measured against your own history.
Heart Rate Variability
48ms Today
Shaded band represents your typical HRV range over the past 90 days.
These are deviations from your personal baseline, not diagnostic values. GRND highlights change; it does not interpret cause.
Personal Health Timeline
See Your Health
As A Story.
Every workout, symptom, lab result, and medication becomes part of one continuous narrative, so change over time actually makes sense.
Aug 12
Workout Detected
Strength training, 48 minutes, moderate training load.
Aug 14
Poor Sleep
Sleep duration 21% below your usual range.
Aug 15
Feeling Unwell
Fatigue logged. HRV and resting heart rate outside usual range.
Aug 16
Medication Added
New prescription logged to health record.
Aug 20
Blood Test Uploaded
Ferritin, Vitamin D, and lipid panel results added.
Aug 28
Recovery Returns to Baseline
HRV and resting heart rate back within your usual range.
In The Moment
“I'm Feeling
Unwell.”
One tap starts tracking the physiological context around how you feel, so the moment becomes part of your data, not just a memory.
How are you feeling?
Pattern Recognition
GRND Learns
Your Patterns.
Similar physiological changes appeared around previous events you recorded. This is personal pattern recognition, not medical diagnosis.
Similar changes appeared around previous events you recorded.
Records
Your Lab Results
Belong In The Story Too.
Import lab work, prescriptions, and doctor visits directly into your timeline. Every record is user-provided or imported, clearly sourced and dated.
Vitamin D
In Range32ng/mL
Reference range: 30–100 ng/mL
Ferritin
Low18ng/mL
Reference range: 20–250 ng/mL
B12
In Range540pg/mL
Reference range: 200–900 pg/mL
HbA1c
In Range5.2%
Reference range: <5.7%
Glucose
In Range96mg/dL
Reference range: 70–99 mg/dL
LDL Cholesterol
High128mg/dL
Reference range: <100 mg/dL
Ecosystem
We Don't Need To Build
Every Sensor.
GRND connects to compatible third-party health devices, becoming the intelligence layer that ties your ecosystem together rather than replacing it.
GRND Wearable
Continuous physiological signal, always on.
Glucose Monitor
Connects continuous or periodic glucose readings.
Blood Pressure Device
Syncs systolic and diastolic readings automatically.
Smart Scale
Weight, body composition, and trend over time.
Women's Health
Your Body Has Context.
Explore the relationship between your cycle, symptoms, and personal physiological trends. GRND surfaces correlations across your data; it does not directly measure hormones.
Current Cycle Phase Overview
During your luteal phase, your recovery has typically run 8–12% below your baseline, and energy scores trend lower in the two days before your period starts.
Health Intelligence
Ask Your Health Data.
A data-grounded personal health assistant. Every answer references your actual physiological history, never a generic response.
Why is my recovery lower this week?
Your HRV has run 16% below your 90-day baseline since Tuesday, alongside two nights of reduced sleep and a strength session with elevated training load.
What happened around the last time I felt unwell?
On Aug 15, your resting heart rate rose 10% and HRV dropped 18% two days before you logged fatigue. A similar pattern appeared before your March entry.
Doctor Summary
When You See A Doctor,
Bring The Context.
A polished, exportable summary of relevant trends, symptoms, labs, and questions, so appointments start with context instead of guesswork.
Health Summary
Last 30 Days
HRV Trend
16% below 90-day baseline since Aug 12
Resting Heart Rate
Elevated 10%, returning to baseline Aug 28
Sleep
3 nights below usual duration this month
Medication
New prescription added Aug 16
Recent Labs
Ferritin low, LDL elevated (Aug 20)
Symptom Log
Fatigue reported Aug 15, resolved Aug 22
Questions to discuss with your healthcare professional
- Could my lower ferritin be contributing to the fatigue I logged in August?
- Should my strength training load change given the recovery pattern this month?
- Is there a connection between my elevated LDL and recent sleep changes?
Response
Know When To Push.
Know When To Pause.
GRND turns your data into a clear, responsible recommendation, never a diagnosis, always grounded in your own patterns.
Today's Guidance
Your recovery is below your usual range today. Consider a lighter session and continue monitoring how you feel.
Product
One Small Device.
A Much Bigger System.
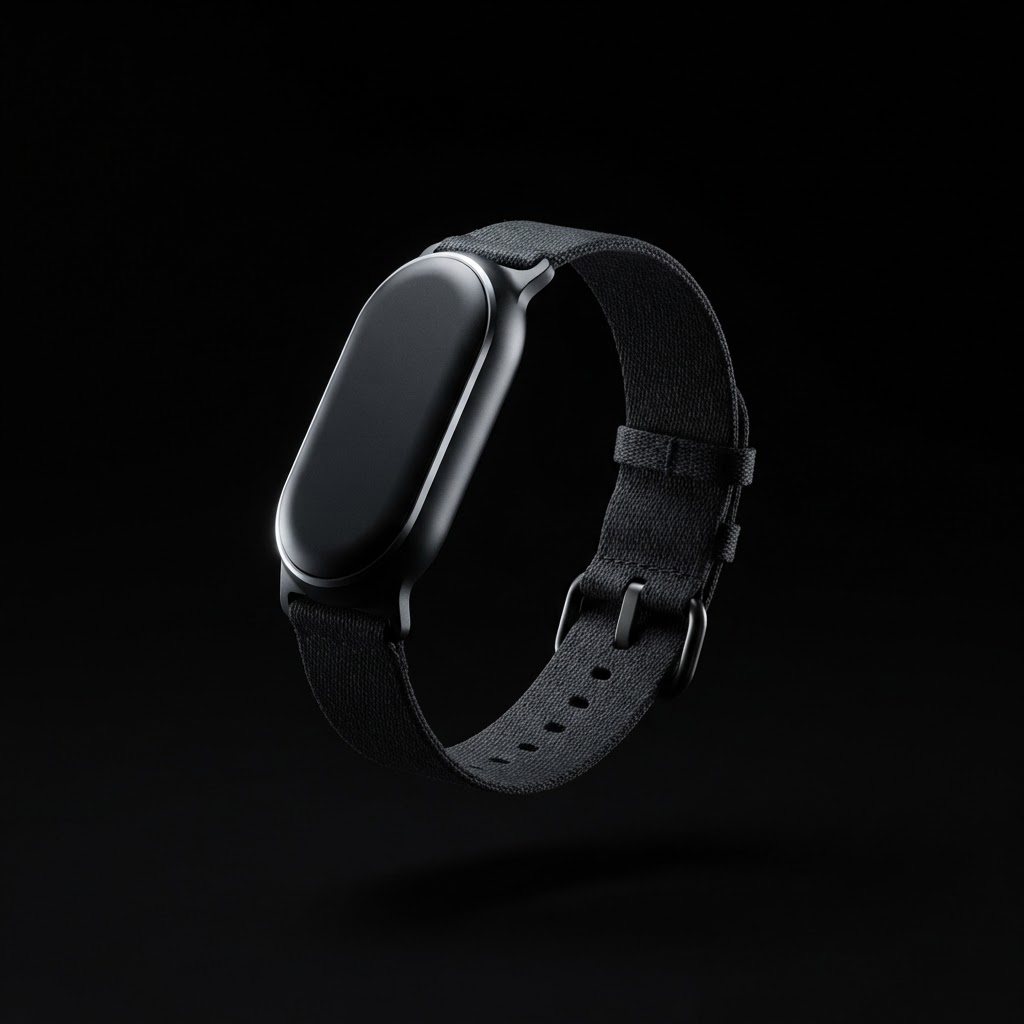
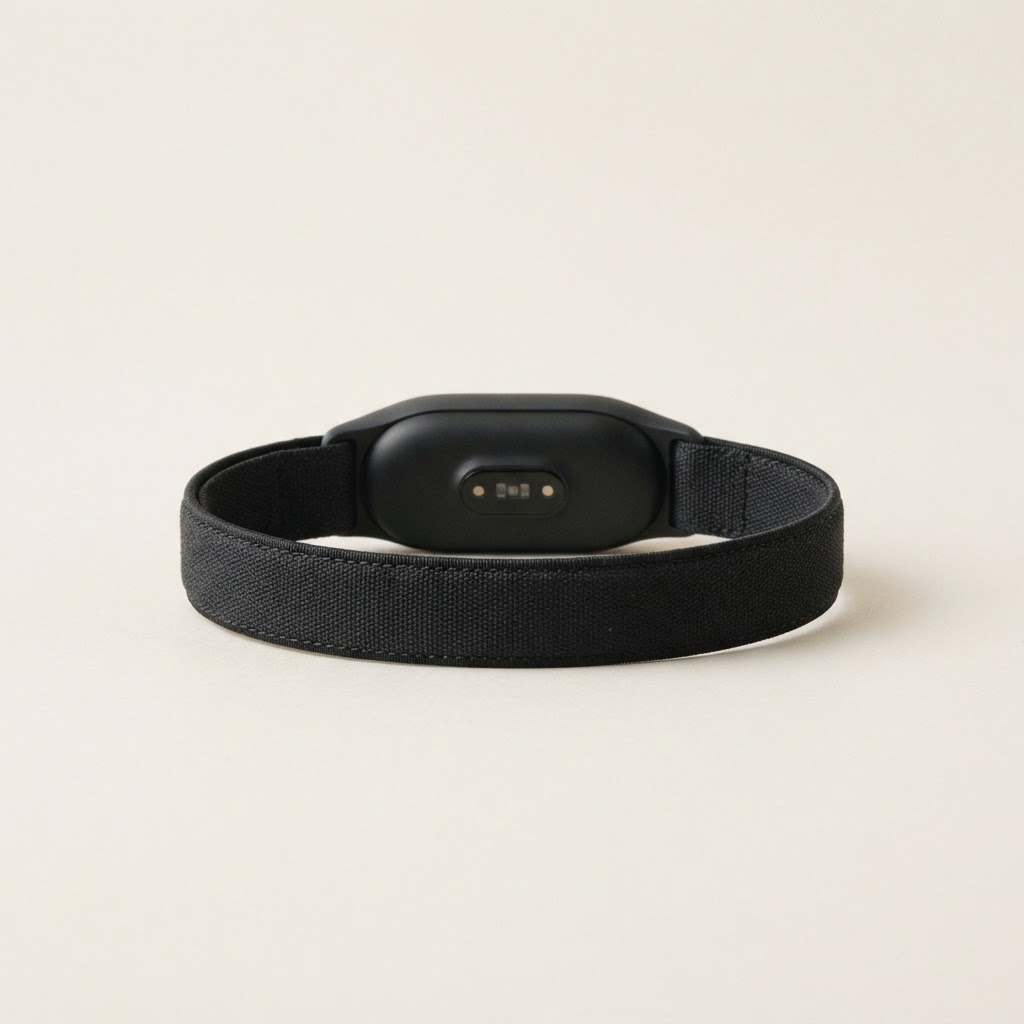
Screenless. Minimal. Premium. A compact sensor module on a soft-touch fabric strap, built to disappear onto your wrist and quietly do its work.
Front*
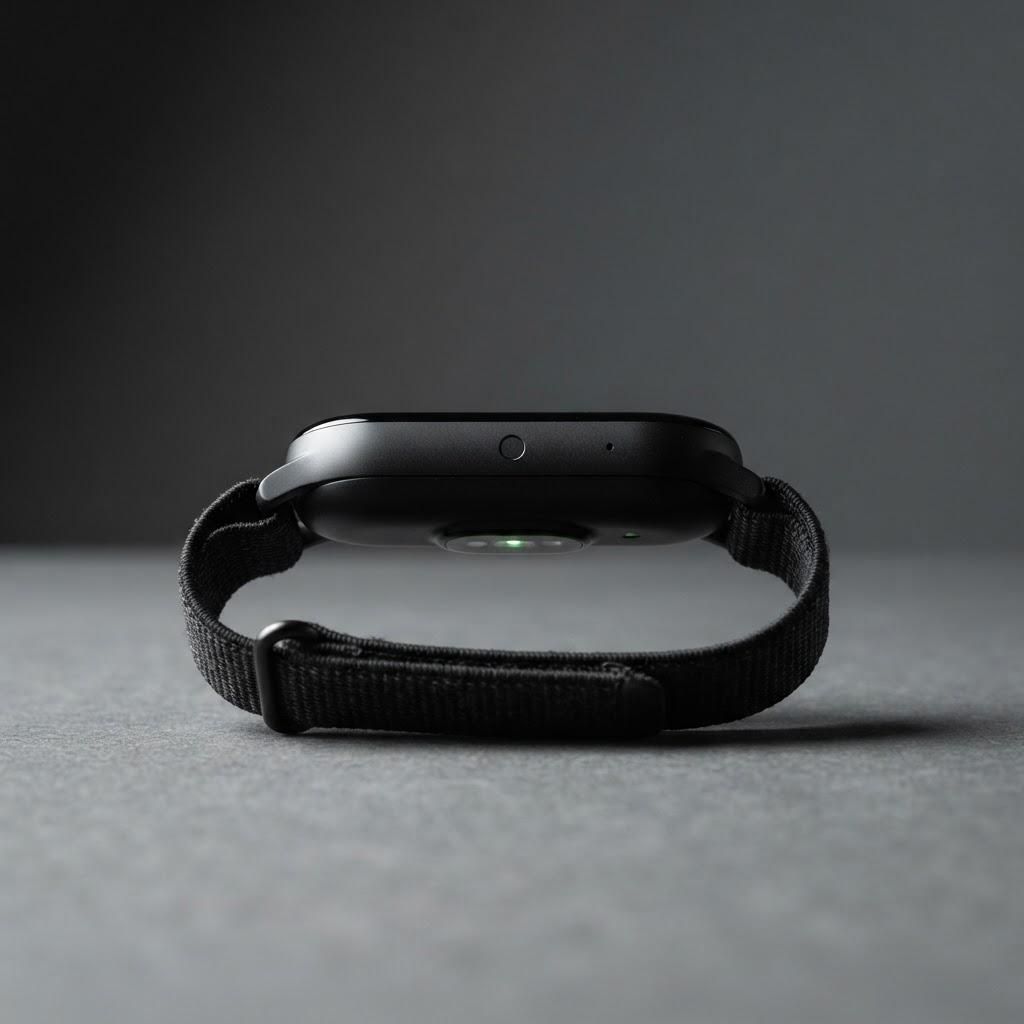
Side*
Underside*
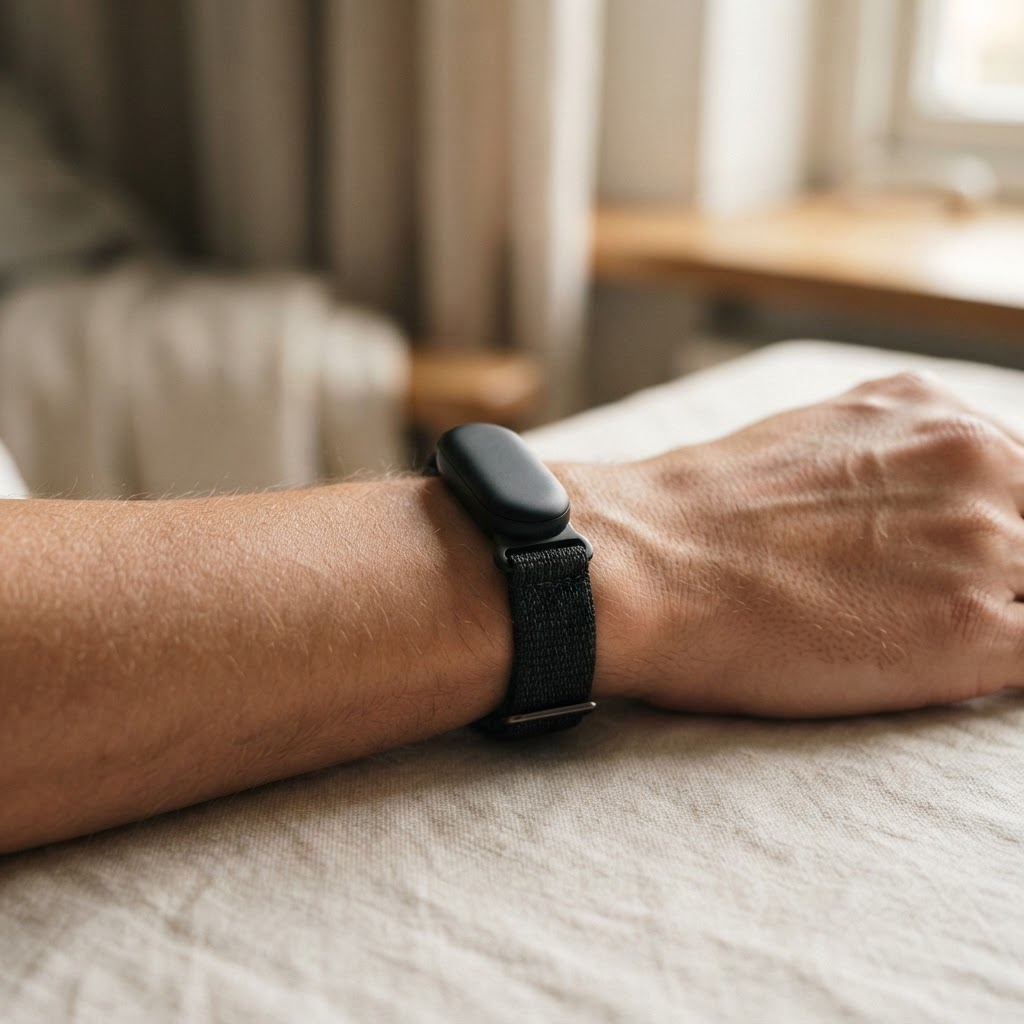
On-Wrist*
How It Works
From Signal To Understanding.
Sense
Continuous physiological signal from the wearable.
Capture
Workouts, symptoms, labs, and devices sync automatically.
Learn
GRND builds a personal baseline unique to your body.
Understand
Deviations and patterns surface as a readable story.
Respond
Clear, responsible guidance grounded in your data.
Share
Bring real context to your next healthcare visit.
Join The Waitlist
Your Body Is
Constantly Talking.
GRND helps you understand what it's saying.